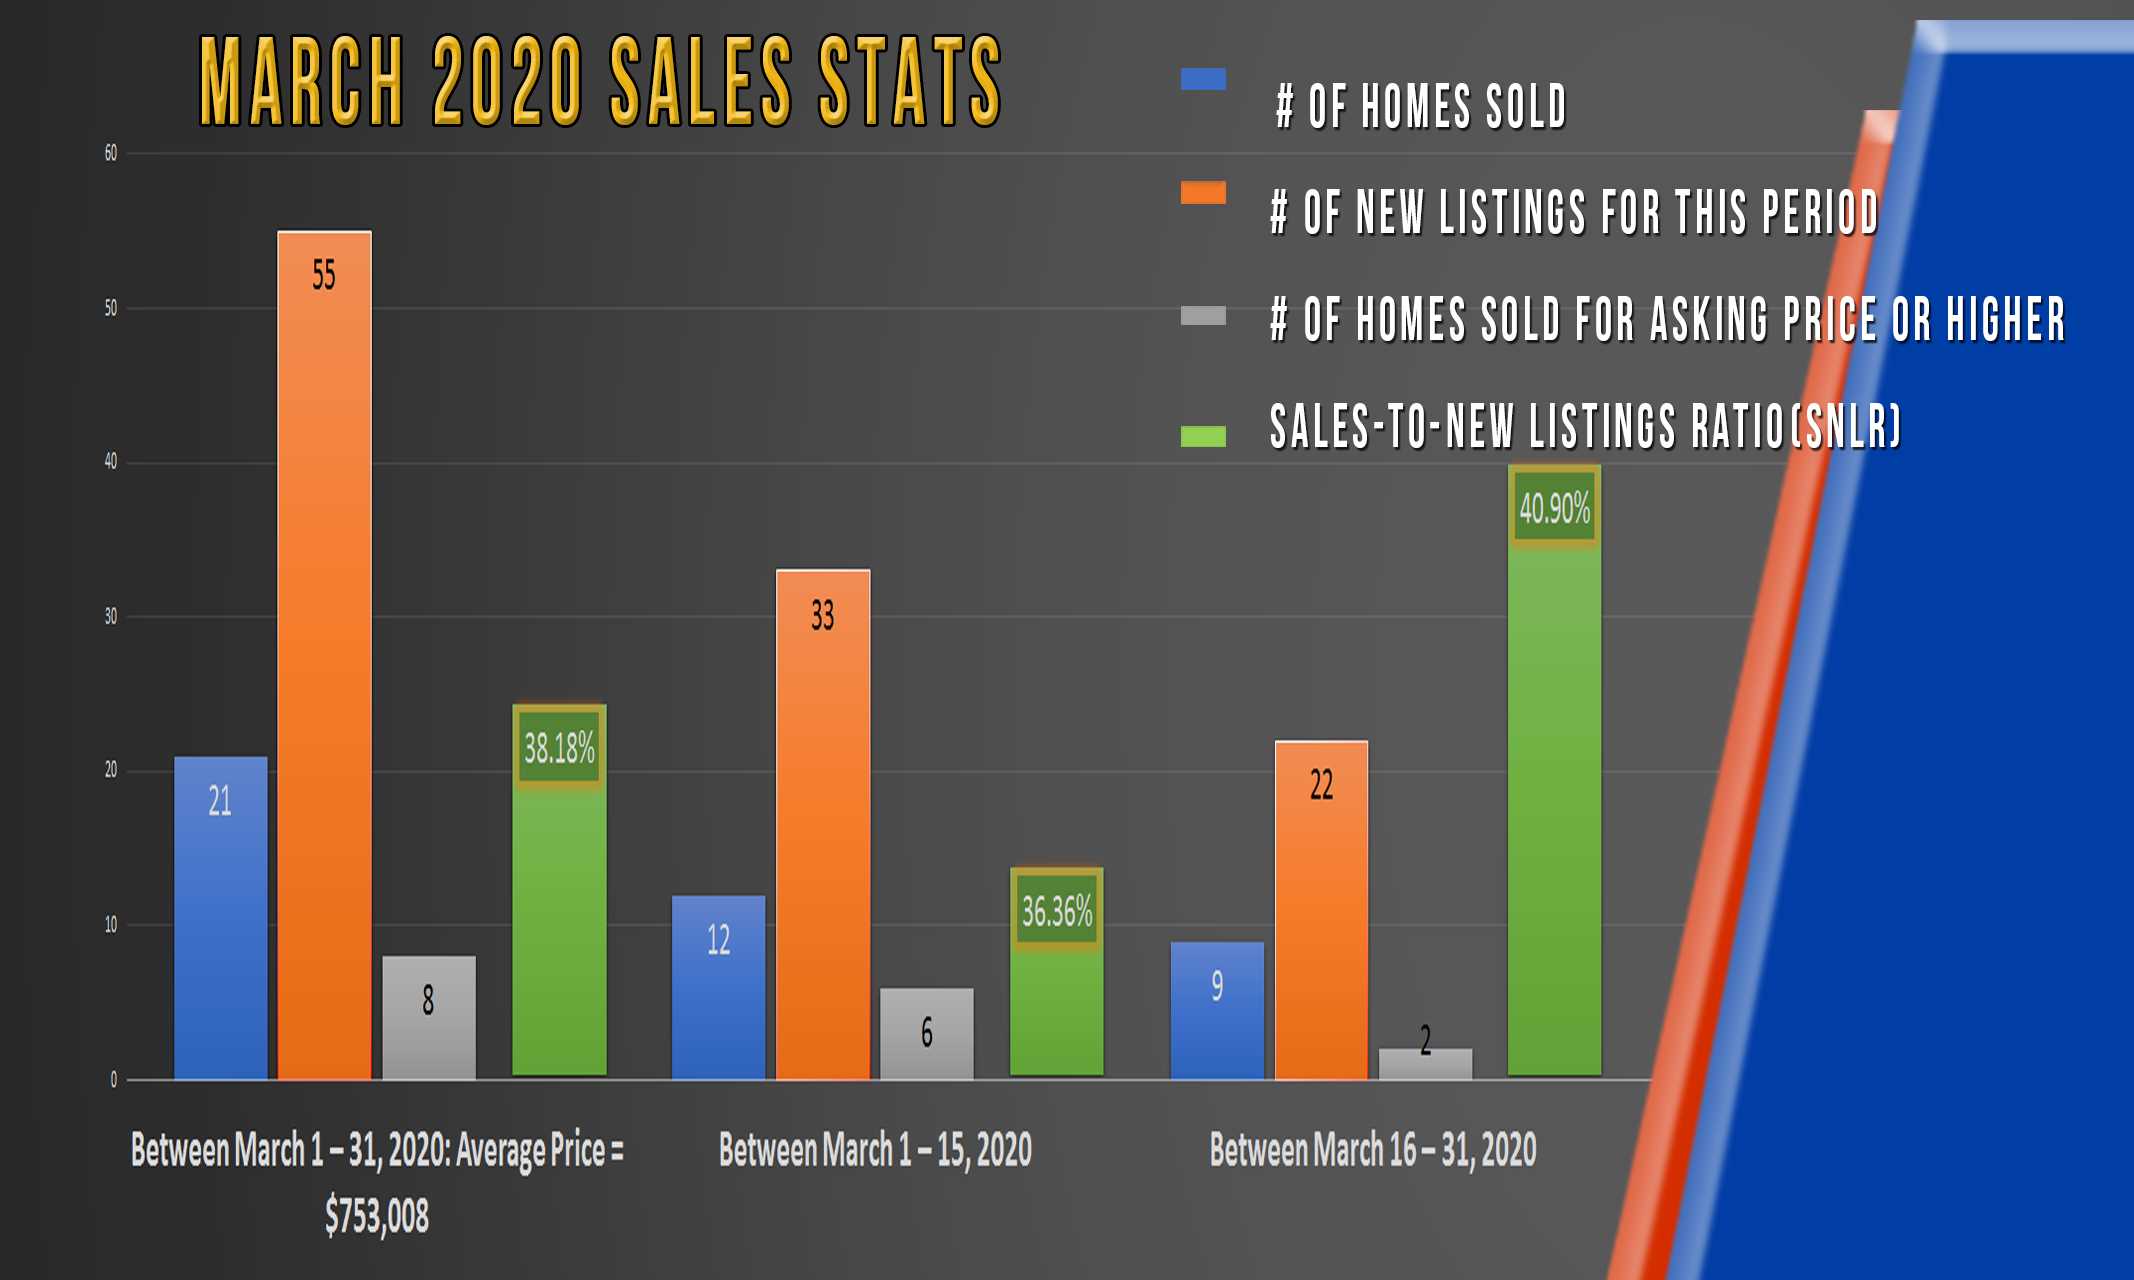
Between March 1 – 31, 2020: Average Price = $753,008
1) # of Homes Sold 21
2) # of New Listings for this period 55
3) # of Homes Sold for Asking Price or Higher 8
4) Sales-to-New Listings Ratio (SNLR) 38.18%
Between March 1 – 15, 2020
1) # of Homes Sold 12
2) # of New Listings for this period 33
3) # of Homes Sold for Asking Price or Higher 6
4) Sales-to-New Listings Ratio (SNLR) 36.36%
Between March 16 – 31, 2020
1) # of Homes Sold 9
2) # of New Listings for this period 22
3) # of Homes Sold for Asking Price or Higher 2
4) Sales-to-New Listings Ratio (SNLR) 40.90%

For those of you that receive my monthly Market Watch newsletter, I always say that
it’s often difficult to compare Uxbridge to the other areas in Durham Region since their
sample size is much smaller than those areas. For example, as of the end of March,
there were still 123 active listings in Ajax, 242 in Clarington, 297 in Oshawa, 178 in
Pickering, 190 in Whitby and only 70 homes still for sale on March 31 st in Uxbridge.
Generally, sale prices in Uxbridge are higher than the other areas. There are a
number of reasons for this – a lot of homes In Uxbridge are on large lots or even
acreage and a great deal of the homes are in exclusive communities with
corresponding estate homes.
To illustrate further how the stats can be skewed by just a couple really low or really
high sale prices, we just have compare the March 2020 Uxbridge sales stats to 2019
and even the hot market of 2017. The average price in March 2019 was $1,038,222
on 23 sales and for March 2017 it was $934,147 on 43 sales. Even though the market
was much stronger last month vs. 2019, there was a large difference in the whole
area’s average price of $285,214!
What does this show us? In extreme markets, even down markets like the beginning
of 2019, the expensive homes in upscale areas are recession-proof since most of the
people buying into those areas don’t need to worry about their job security or their
income.
We would like to hear from you! If you have any questions, please do not hesitate to contact us. We are always looking forward to hearing from you! We will do our best to reply to you within 24 hours !
